Module 1, Practical 10
Part 1
Some years ago, researchers collected a dataset called “Copenhagen Network study”. They collected several informations among 700 universitary students. In this exam, we are intrested in:
the list of phone calls calls.csv
Information about Facebook friendships fb_friends.csv
The gender of the students genders.txt
the data are like follows:
calls.csv
timestamp,caller,callee,duration
184,300,301,121
3920,512,299,670
fb_friends.csv
# user_a,user_b
0,512
0,263
0,525
gender.txt
0_M 2_M 3_M 4_M 5_M ...
you have to write a program that computes the following:
Search for the call with the longest duration.
Are the caller and the callee friend on Facebook?
Print the gender of the students belonging to the longest call
Interactions are given in seconds, you have to discretize them! Each interactions appening in 1 houar have to be discretized into 1. for instance input CALLS
    time  id_a id_b duration
[
    [  184,   300,   301,   121],
    [ 3920,   512,   299,   670],
    [ 5623,   301,   300,   504],
    [ 9252,   401,   457,    -1],
    [15466,   512,     0,     5],
    [15497,   512,     0,    28],
    [26400,    19,    47,   619],
    [31312,   687,   310,    11],
    [36265,   300,   301,    74],
    [37049,   634,   681,    20],
   ...,
]
output CALLS
    time  id_a id_b duration
[
    [  0,   300,   301,   121],
    [  1,   512,   299,   670],
    [  1,   301,   300,   504],
    [  2,   401,   457,    -1],
    [  4,   512,     0,     5],
    [  4,   512,     0,    28],
    [  7,    19,    47,   619],
    [  8,   687,   310,    11],
    [ 10,   300,   301,    74],
    [ 10,   634,   681,    20],
   ...,
]
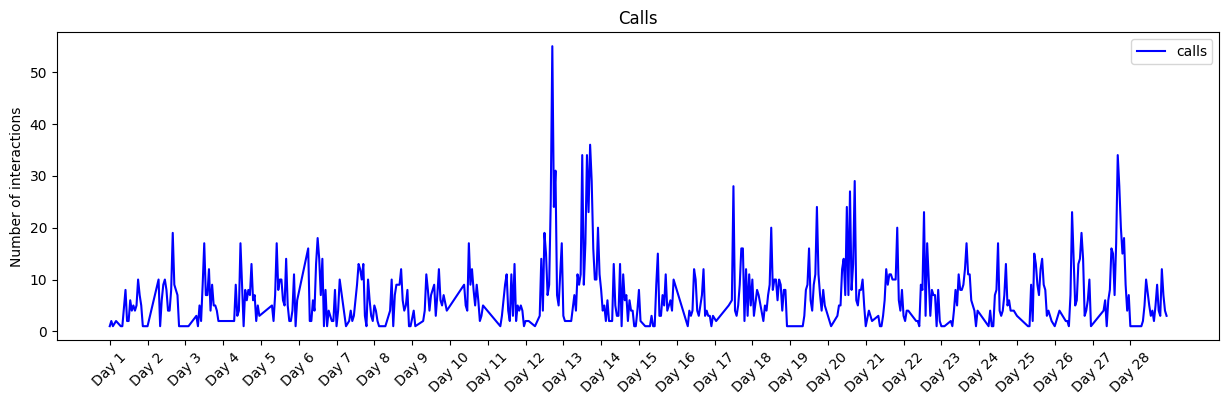
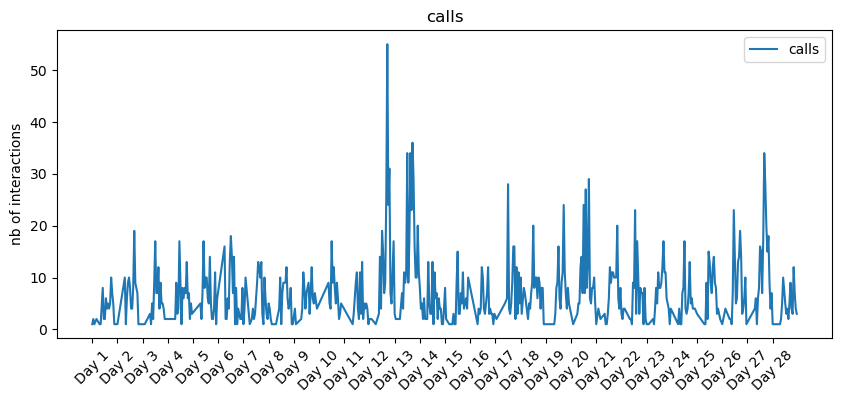
then plot those interactions, you should obtain a plot like the one bellow! pay attention to x and y labels
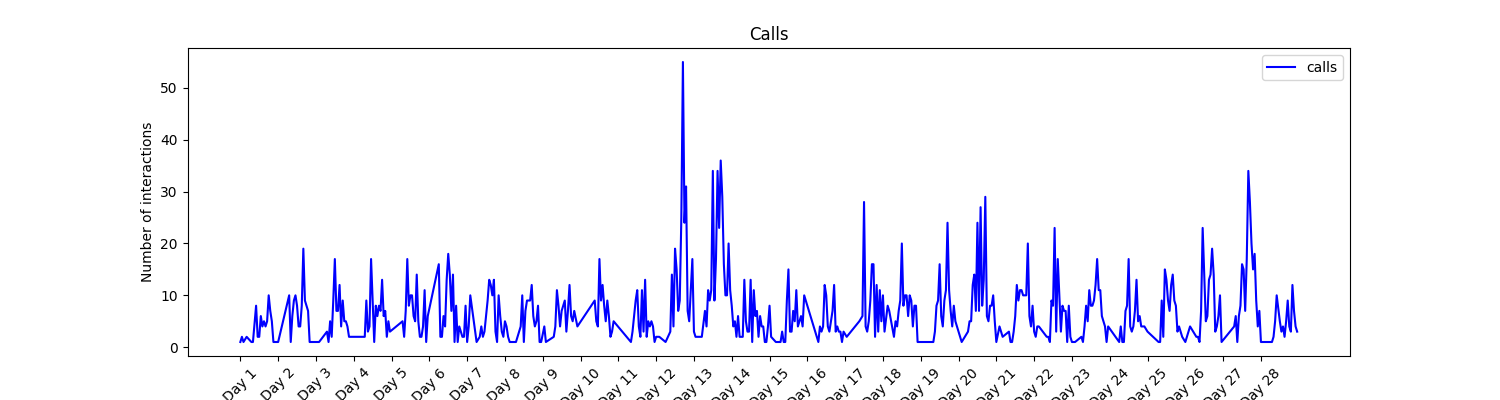
NOTE you should define a function for each point.
Show/Hide Solution
[ ]: