Module 1, Practical 10
Part 1
Several years ago, researchers compiled a dataset known as the “Copenhagen Network study”. This dataset includes a range of information collected from 700 university students. In this exam, we will focus on the following files:
A list of phone calls: calls.csv
Information about Facebook friendships: fb_friends.csv
Student gender data: genders.txt
The data in these files are structured as follows:
calls.csv
timestamp,caller,callee,duration
184,300,301,121
3920,512,299,670
fb_friends.csv
# user_a,user_b
0,512
0,263
0,525
gender.txt
0_M 2_M 3_M 4_M 5_M ...
Write a program that performs the following tasks:
Find the Longest Call: Identify the call with the longest duration from the dataset.
Check Facebook Friendship: Determine if the caller and receiver in the longest call are friends on Facebook.
Display Genders: Print the gender of both students involved in the longest call.
Discretize Interaction Durations: Convert the duration of each interaction from seconds into hourly units. Any interaction that occurs within one hour should be rounded up to 1 (for example, 45 minutes or 3600 seconds both discretize to 1 hour).
Input: The program should take in the file CALLS.
    time  id_a id_b duration
[
    [  184,   300,   301,   121],
    [ 3920,   512,   299,   670],
    [ 5623,   301,   300,   504],
    [ 9252,   401,   457,    -1],
    [15466,   512,     0,     5],
    [15497,   512,     0,    28],
    [26400,    19,    47,   619],
    [31312,   687,   310,    11],
    [36265,   300,   301,    74],
    [37049,   634,   681,    20],
   ...,
]
output CALLS
    time  id_a id_b duration
[
    [  0,   300,   301,   121],
    [  1,   512,   299,   670],
    [  1,   301,   300,   504],
    [  2,   401,   457,    -1],
    [  4,   512,     0,     5],
    [  4,   512,     0,    28],
    [  7,    19,    47,   619],
    [  8,   687,   310,    11],
    [ 10,   300,   301,    74],
    [ 10,   634,   681,    20],
   ...,
]
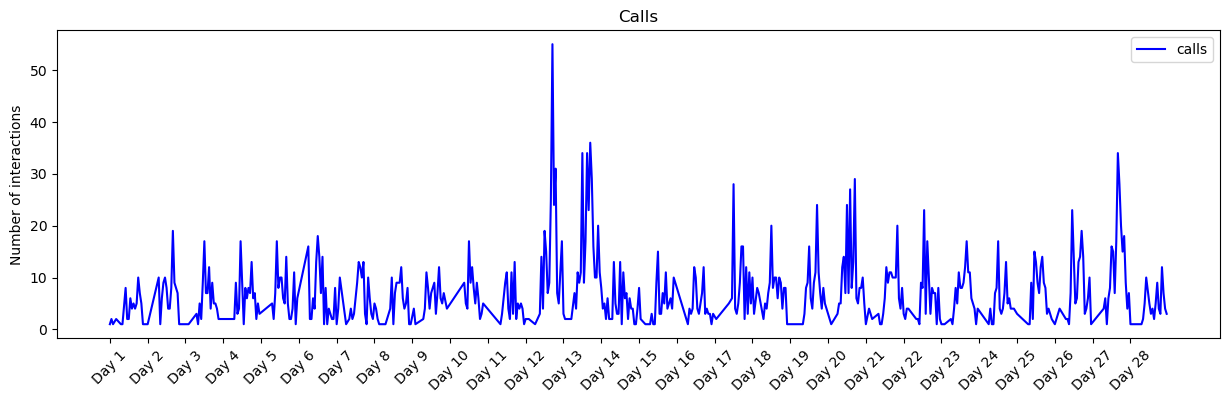
then plot those interactions, you should obtain a plot like the one bellow! pay attention to x and y labels
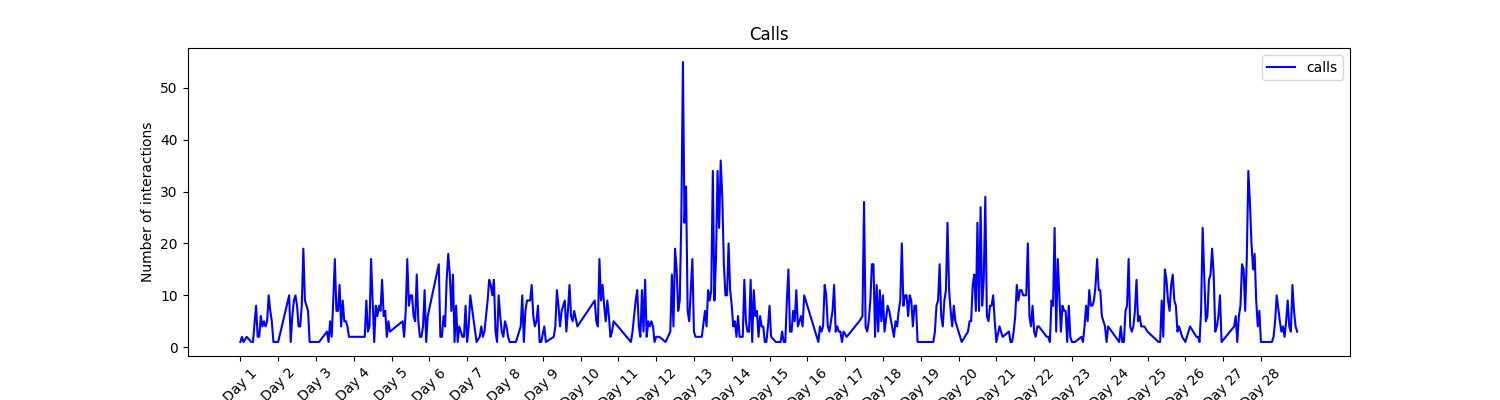
Persistent Score: Researchers define a Persistent Score to measure how repetitive the interactions between two students are. A pair of studens (a,b) is said to be persistent if they repeatedly call themself multiple times within short time intervals.
Definition of Persistent Score For every pair of students (A, B), we sort all their calls chronologically and count how many consecutive calls occur within 2 hours of each other (i.e. \(\Delta\) time \(\leq\) 7200 seconds). The Persistent Score of a student S is the total number of such “persistent interactions” they participate in.
Let \(C = \{(a_i, b_i, t_i)\}_{i=1}^N\) be the set of call records, where each tuple \((a_i, b_i, t_i)\) represents a call from student \(a_i\) to student \(b_i\) at timestamp \(t_i\) (in seconds).
For each unordered pair of students \((A, B)\) (with \(A \neq B\)), consider the ordered set of timestamps of all calls between them:\(T_{AB} = \{ t_1, t_2, \dots, t_k \}, \quad \text{with } t_1 < t_2 < \dots < t_k\)
Define the number of persistent interactions between \(A\) and \(B\) as:
\[P_{AB} = \sum_{i=1}^{k-1} \mathbb{1}\{ |t_{i+1} - t_i| \le 7200 \}\]where \(\mathbb{1}\{\cdot\}\) is the indicator function, equal to 1 if the condition holds and 0 otherwise.
-The Persistent Score of a student \(S\) is then: \(PS(S) = \sum_{B \neq S} P_{SB}\)
That is, the total number of persistent interactions in which student \(S\) participates.
In other words, we look at all the calls exchanged between every pair of students. For each pair \((A, B)\), we sort their calls by time and check how many times they call each other again within two hours of a previous call (i.e. within 7,200 seconds). Each such occurrence counts as a persistent interaction for that pair. Then, for each student \(S\), we compute their Persistent Score by summing up all the persistent interactions they are involved in — that is, all the times \(S\) called or was called again within two hours by any other student.
Intuitively, a higher Persistent Score means that the student tends to interact repeatedly with the same people in short time intervals, showing a more persistent communication pattern.
Write a function that: - Computes the persistent score for all students. - Returns the top 3 students with the highest persistent scores. - Prints for each of them: 1. Their ID 2. The total number of persistent interactions 3. Their gender
NOTE Define a function for each analysis step, and a main() function using argparse.
The arguments should be: - the paths to the input files (calls.csv, fb_friends.csv, genders.txt) - and the name of the output file for saving the plot.
Each function must handle one point of the analysis, and the main() should execute them in order.
Show/Hide Solution
[ ]: