Module 1, Practical 10
Part 1
Several years ago, researchers compiled a dataset known as the “Copenhagen Network study”. This dataset includes a range of information collected from 700 university students. In this exam, we will focus on the following files:
A list of phone calls: calls.csv
Information about Facebook friendships: fb_friends.csv
Student gender data: genders.txt
The data in these files are structured as follows:
calls.csv
timestamp,caller,callee,duration
184,300,301,121
3920,512,299,670
fb_friends.csv
# user_a,user_b
0,512
0,263
0,525
gender.txt
0_M 2_M 3_M 4_M 5_M ...
Write a program that performs the following tasks:
Find the Longest Call: Identify the call with the longest duration from the dataset.
Check Facebook Friendship: Determine if the caller and receiver in the longest call are friends on Facebook.
Display Genders: Print the gender of both students involved in the longest call.
Discretize Interaction Durations: Convert the duration of each interaction from seconds into hourly units. Any interaction that occurs within one hour should be rounded up to 1 (for example, 45 minutes or 3600 seconds both discretize to 1 hour).
Input: The program should take in the file CALLS.
    time  id_a id_b duration
[
    [  184,   300,   301,   121],
    [ 3920,   512,   299,   670],
    [ 5623,   301,   300,   504],
    [ 9252,   401,   457,    -1],
    [15466,   512,     0,     5],
    [15497,   512,     0,    28],
    [26400,    19,    47,   619],
    [31312,   687,   310,    11],
    [36265,   300,   301,    74],
    [37049,   634,   681,    20],
   ...,
]
output CALLS
    time  id_a id_b duration
[
    [  0,   300,   301,   121],
    [  1,   512,   299,   670],
    [  1,   301,   300,   504],
    [  2,   401,   457,    -1],
    [  4,   512,     0,     5],
    [  4,   512,     0,    28],
    [  7,    19,    47,   619],
    [  8,   687,   310,    11],
    [ 10,   300,   301,    74],
    [ 10,   634,   681,    20],
   ...,
]
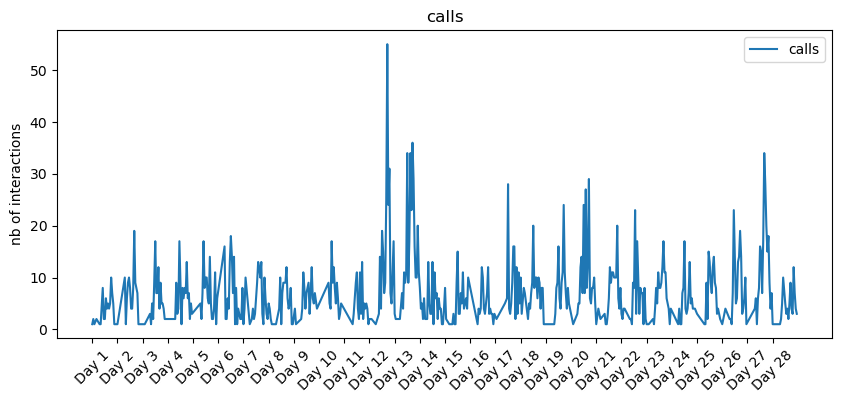
then plot those interactions, you should obtain a plot like the one bellow! pay attention to x and y labels

NOTE you should define a function for each point.
Show/Hide Solution
[ ]:
